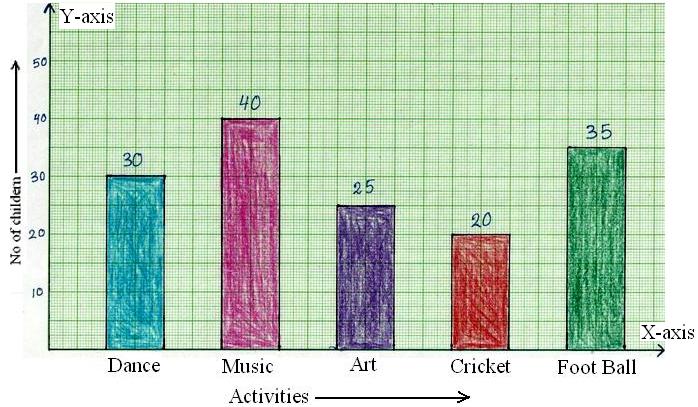
Mrs. Loving's Math Class
Home
Where Are We Going?
Tools to Use
Resources
Clipboard Math
6th Grade Math Techbook
Number System
>
Prime, Composite, GCF, LCM
Distributive Property
Fractions, Decimals, Percents, and Exponents
>
Percent Proportions
Integers
Expressions & Equations
>
Expressions and Variables
Equations and Inequalities
Ratios and Proportions
Geometry
>
Coordinate Plane
3D, Volume and Surface Area
Statistics and Probability
>
Box and Whisker Plot
Stem and Leaf Plot
Histogram and Bar Graph
Advanced Math Topics
Vocabulary Page
Parent Page
Class Syllabus
Common Core Standards
Contact Mrs. Loving
Need Help?
Bar Graphs
Bar graphs are used to display data in a chart. It uses bars on a coordinate plane to show the frequency of numbers.
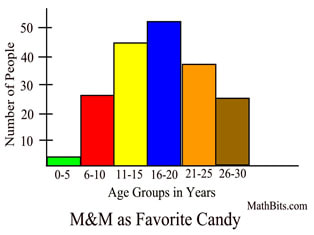
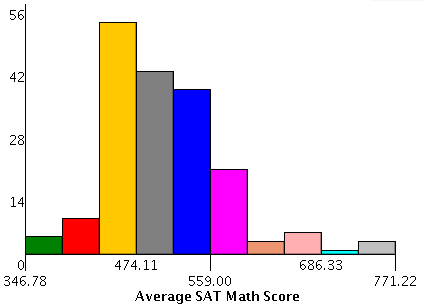
Histograms
Histograms are used to show data. They are similar to a Bar Graph, except there are no spaces between the bars.